-
Introduction
eduViz is a visualization project that aims to make sense of the recently-released College Scorecard Data. The dataset, provided by the Department of Education, contains information on higher-education institutions. Some of the metrics provided are admission rates, student completion rates, debt and repayment, earnings, demographics and more. The dataset contains nearly twenty years of data, with about 1700 variables tracked. Most of this visualization will focus on data from 2013.
Availability of variables and their associated values becomes sparse in earlier years of the dataset. Cohort earnings data is from 2011 (most recent available).
This analysis is designed for data scientists, analysts, and others with statistical literacy. Others looking to create data graphics, articles, or more focused analyses will find this project useful. In particular, members of the Kaggle community can benefit from it. An effort is made to ensure that the analysis is replicable and transparent for others. While analysis is thorough and focuses on many variables, it is by no means exhaustive.
Process - Data manipulation
Due to the immensity and complexity of the dataset, a meticulous approach to data manipulation is required. In the interest of providing full transparency to the process, I have documented every step taken to parse the dataset. This is also done to ensure that other data scientists and developers can reproduce the parsed data and get the same result. The key tools used are Python, sed, and csvkit. A detailed Jupyter Notebook with code in Python and Bash is available.
-
Terms of Importance
Before diving into the data, it is useful to understand certain terms as they relate to higher education. It is particularly important to understand terms related to lending practices. Recently, many institutions' lending practices have been called into question, and much controversy arises on the subjects of tuition, loans and grants.
-
Title IV
Most data from the College Scorecard dataset apply only to Title IV students, or students receiving federal grants or loans. EduViz focuses moreso on grants, a type of financial aid that doesn't need to be repaid. Title IV aid varies in the conditions necessary to receive it - often it is provided on the basis of a student's financial need, or outstanding academic achievements. For the purpose of this project, analysis will focus on the most relevant form of Title IV aid, the Pell Grant.
-
The Pell Grant
A Pell grant is aid given by the federal government, based on student need. A Pell grant is an entitlement, meaning that it does not have to be paid back by the borrower. Our dataset provides the percentage of students receiving Pell grants for each given university. This can be used as an indicator of how well an institution serves low-income students. Institutions with a high percentage of students receiving Pell grants will better accomodate poorer students.
Pell grants are administered by the US Department of Education, who assess information reported on a student's FAFSA (Free Application for Federal Student Aid.) Metrics such as expected family income are used to determine a student's eligibility. Pell grants are generally considered the foundation of a student's financial aid package. These visualizations may use the variable PctPell to describe the percent of students receiving Pell grants at an institution.
-
Public, Private, and for-Profit Schools
One of the focuses of this visualization project is to understand differences between public and private universities. The key difference is that public universities are funded by state governments, whereas private universities don't receive any state funding. Public universities generally offer lower tuition rates because they are subsidized, while private universities rely on higher tuition rates and generous private contributions to cover operating costs.
Private schools exist as either nonprofit or for-profit institutions. For-profit schools are operated privately by profit-seeking businesses. While for-profit schools are thought to fulfill an economic need of education, they are frequently criticized for their lending practices, tuition costs, and dismal student outcomes. In the dataset, the type of institution may be referred to as Control.
-
Accreditation
An accredited school is one recognized as meeting standards of education, admission, and student outcomes. The aim is to ensure that schools maintain a quality level of education. Accrediting agencies exist to determine how well certain schools are meeting their standards; these external orgnizations will determine whether or not a school is given its 'accredited' status.
-
-
Findings
-
Public schools are well-funded and generally yield favorable outcomes.
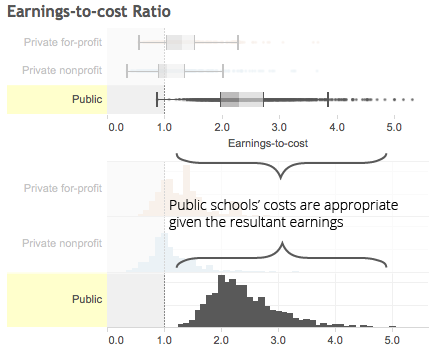
Evaluating if an education is worthwhile can be modeled using cost and earnings data. Each school is given an earnings-to-cost ratio, calculated by dividing median annual earnings by annual cost.
In plotting this metric, an interesting trend occurs for public schools. The histogram shows that almost every public school has an earnings-to-cost ratio greater than one.
The key inference of this observation is that public schools appear to be well-funded, offering affordable opportunities to enhance occupational prospects.

-
Schools with greater share of ethnic minorities generally have lower completion rates and earnings.
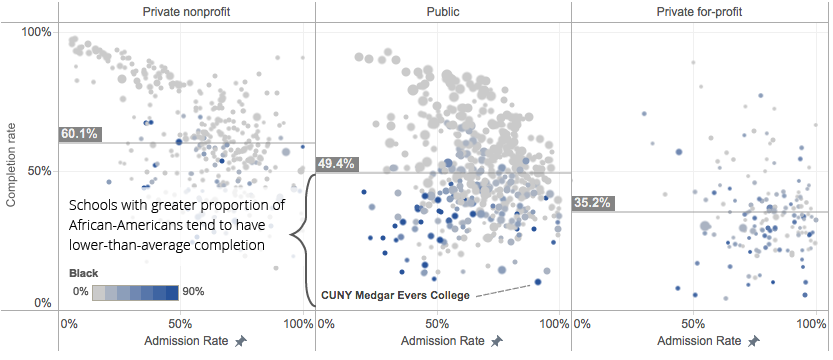
The scatter plot below shows schools by completion and admission rates. Each dot is a school; horizontal lines indicate average completion rates. The darker the color of the data point, the greater the proportion of black students at that university.

It is interesting to note that for public schools, along with quite a number of private for-profit schools, those schools with greater proportion of black students tend to have lower completion rates. It is difficult to interpret this observation, but one can speculate.
There is a demonstrable correlation between socioeconomic status and academic ability. A recent New York Times article shows the degree to which income and affluence affect academic achievement. The College Scorecard analysis affirms the notion that students from poorer families will experience greater challenges academically, and that academic gaps persist into post-secondary education.
-
A high-cost of education does not necessarily guarantee good earnings.
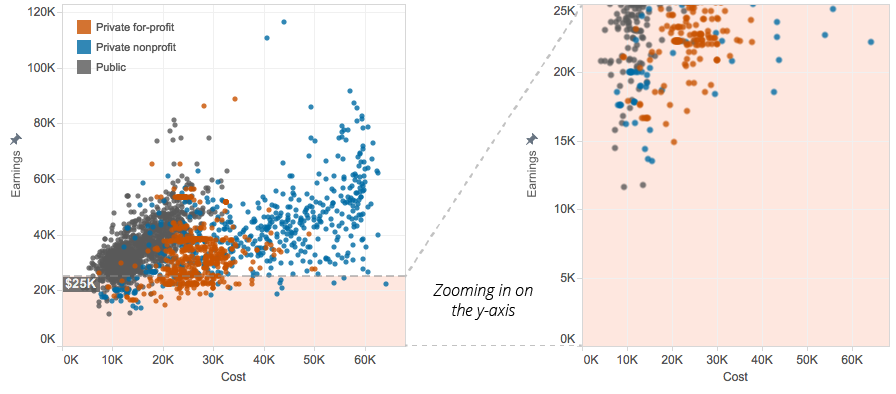
Private schools that focus on providing educations in art, music, or other non-STEM degrees can provide dismally-low earnings compared to their cost.

There are an alarming number of expensive private schools that report low median earnings for their students (10 years after matriculation). The table below lists the 10 most expensive schools for which median earnings are under $25,000:
Type School Name Median Yearly Cost Median 10-year Earnings Private nonprofit Landmark College 64,233 22,200 Private nonprofit San Francisco Art Institute 55,809 24,600 Private nonprofit Manhattan School of Music 53,903 22,700 Private nonprofit Pennsylvania Academy of the Fine Arts 43,656 20,900 Private nonprofit Maine College of Art 43,313 23,700 Private nonprofit Pacific Northwest College of Art 43,235 22,600 Private nonprofit Naropa University 42,575 18,600 Private nonprofit Montserrat College of Art 37,866 25,100 Private for-profit Advertising Art Educational Services DBA School of Advertising Art 37,702 22,200 Private for-profit AmeriTech College-Draper 37,574 23,800
Important to note is that Landmark College is an institution that specializes in educating students with learning disabilities. This school differs greatly from most in its objective and can be considered an anomaly.
-
-
Your School at a Glance
While analysis focuses on aggregate metrics from this dataset, some will take interest in viewing a given school.
Use the Search for a School form to find a school, select it and click View summary. -
How Colleges Spend Money
In order to hold an institution accountable for lending practices, and maintaining standards of accessibility and affordability, it is helpful to understand where universities get their money. These diagrams detail tuition revenue per full-time student and average monthly faculty salary. These metrics provide a proxy for how universities source their revenue, and the caliber of teaching faculty they strive to maintain.
-
Is College Worth It?
Amidst stagnant economic growth and a precarious job market, many question whether or not a college-level education is worth having. The dataset provides some useful metrics in evaluating outcomes from these institutions. Earnings data exists is provided in numerous forms. Important to note is that these figures are taken from 2011, the most recent years in which earnings were reported. Because these are 10 year cohort groups, the numbers correspond to the group of students who enrolled from 2001-2002.
In order to decide whether or not a given institution provides students with favorable outcomes, one must compare the cost of education with the outcome. Analysis will use cost and earnings metrics to determine this. Of key importance are:
- Median cost of attendance - This is a more reliable metric than using tuition; the College Scorecard includes this variable, which gives average annual cost of attendance, accounting for tuition, fees, books, supplies, and living expenses.
- Median earnings 10 years after matriculation - Median student earnings for all federally aided students who are employed, but not enrolled.
- Threshold earnings - These variables provide us with the share of students who earn more than a certain amount. For instance, one might examine the share of students who make greater than $25,000 a year. The threshold of $25,000 was chosen by College Scorecard because it represents the median wage of workers ages 25 to 34 with only a high-school education.
- Earnings-to-cost ratio - This metric is calculated by dividing median earnings by average cost of attendance. Other things equal, a higher earnings-to-cost ratio suggests that the school succeeds in providing marketable skills for its tuition. In theory, schools with an earnings-to-cost ratio lower than 1.0 suggest that the education does not yield sufficient returns to justify the cost.
Cost and Earnings
Comparing cost and earnings is a good place to start. While there are some limitations with the earnings data, the aggregate figures can give us a good insight as to overall market trends.
-
Demographics
The dataset gives us a generous array of variables with which to examine demographics. With these variables, we can paint a broad picture of what higher-education student population looks like at a number of institutions. The intricacy and granularity of our variables can also allow us to drill down further and look for patterns of interest.
Some of the key demographic variables we are interested in are:
- Race - Data can tell us the percentage of undergraduates that are white, black, hispanic, asian, and of other racial background. If sufficient data is present, we may be able to determine trends in accessibility for minorities, as well as determine a level of diversity/integration at the university level.
- Student dependence status - Students who rely on financial support from their parents or family members are usually considered dependent. There has been recent speculation that certain institutions deliberately target independent students as part of a predatory lending intent. As our data are high-level aggregate figures, we likely cannot draw a conclusion with certainty from our dataset. However, there might be suggestive patterns present.
- Family income - The dataset breaks out student population into groups of income, which may help to illustrate which institutions are a good match for a student given their family's income.
- First-generation - It has also been speculated that first-generation students are sometimes targeted with offers financial aid and job prospects, only to be saddled with debt.
Race: High-level Overview
Race: Admission and Completion
Many of the most prestigious and costly universities also have high completion rates. However, these schools are often very homogenous (Caucasian) and lack racial diversity. One finding of this data exploration is that schools with greater diversity have lower completion rates. It isn't feasible to draw a causal link with this information, but lower completion rates in more diverse schools suggest that ethnic minorities may not have the same opportunities.
-
Project Plan
eduViz was completed as part of my Capstone Project at University of Miami's IMFA program. The accompanying project plan and documentation for this project can be found below:
